BALTIC FREIGHT INDEX

BALTIC Freight Index is a leading indicator of spot dry bulk cargo rates. It is not a shipping index, but an indicator of the bulk cargo market.

BFI is more relevant for bigger ships and most Indian shipping companies. It is calculated by the Baltic Exchange, which is based in London and is a key market for the global shipping business.

BFI is a weighted average based on 11 international ship routes and three major commodities namely coal, iron ore and grain. It reflects on the freight and charter rates of the above commodities on these routes. The index uses January 4, 1985 equals 1,000 as base.

BFI earlier represented all freight rates for all the vessels. It was split in late 1996, to represent only Panamax vessels (70 per cent) and Capesize vessels (30 per cent) on a weighted average basis.

BFI is now used for bigger ships such as Panamax and Capesize vessels. A Panamax vessel is a vessel that is capable of navigating through the Panama Canal and has a 50,000-80,000 tonnage, while Capesize vessel means that vessel that can navigate through the Cape of Good Hope and is capable of carrying 1,00,000-1,30,000 tonnage.

SAMPOORNA

DSC03626

Sampoorna has definitely changed my life. For a person like me, who hardly speaks Tamil, I thought it would be difficult to converse and in teaching the street children in Chennai, English or simple Maths. But as I started, I realized that language is not a barrier when you have a strong urge to do what you want to do.

As I interacted with the street kids, I realized that they are a lot like us and need proper guidance to be molded in the right way. This is exactly what the Good Shepherd Sisters in Chennai, provide to them.

Helping the blind by scribing for them, bringing a smile to the faces of differently abled students has changed my perspective about the way I look at things. I have realized that I should be thankful for every small little thing that has been provided to me and never complain.

I feel we should return something back to the society that we live in and I found this one of the best ways in returning to the society by helping someone in need or someone less privileged than us.

  • The smile that you get from a kid who has just learnt a new word in English.
  • The hug that you receive after you are just done scribing for a blind girl.
  • The blessings you receive when you take old-aged people to the beach for a fun day out.
  • The satisfied expressions you get when you are just done dancing and singing for the cancer patients.

Nothing in the world is better than this….!!! I would not trade anything for this.

Sampoorna has made me realize that everyone is equal and that no one is below or above us and no one is disabled but they are just differently abled.

If I find myself more mature today I owe all the credit to Sampoorna and the Good Shepherd Sister’s. And it goes without saying that I owe a big thank you to my guide – Sashi Mam, Thank you!!

Thank you to Sr.Mercy George for supporting us and allowing my friends and me to come up with this awesome group which has touched sooo many lives – ours as well as the people we have reached out to.

“Sampoorna” – wholeness – all in one!!

Reach out to the world around you… there is a lot to do!!

TEXAS RATIO

ratio-logo1

The TEXAS ratio is developed by a man named Gerald Cassidy as well as other analysts and is used to measure the credit problems of particular banks or maybe regions of banks. It usually takes into account the amount of a banks NPA’S i.e its non-performing assets as well as loans and divides it by the firms tangible capital equity plus its loan loss reserve. The NPA’S and loans also includes loans delinquent for more than 90 days.

This ratio was initially applied to banks in Texas in the 1980’s and proved useful for them till the early 1990’2. This ratio can be useful when a bank’s balance sheet has assets that are falling in value, for example mortgage assets. This ratio was mainly developed as an early warning system to identify potential problems in banks.

WATER TREATMENT

Water treatment is an industrial processes that makes water more acceptable for various purposes like maybe drinking, industrial, or medical purposes. Water treatment is not like small-scale water sterilization that people practice in wilderness areas.

Water treatment in simple words means the removal of existing water contaminants or reducing their concentration so that the water becomes fit for its desired end-use, which could be safely returning used water to the environment.

The processes involved in treating water for drinking purposes could be either solids separation using physical processes such as settling and filtration or chemical processes such as disinfection and coagulation.


Growth Factors

 Rural India seems to be moving to urban centers leading to an explosion of our cities. It is estimated that these cities will soon hold 50% of the total population of India. This would require a huge addition to the capacity of water and wastewater treatment facilities in these cities.

 The industrial zones are also usually located in densely populated areas to enable them to easily tap the available natural and human resources. This increases demand on the available water sources leading to contamination and scarcity of water.

 Water scarcity of safe drinking water for urban and rural populations and possibility of using alternative sources of water, like the sea water by industries for their captive consumption are some of the factors that would drive growth of water treatment technologies and products in India.

Image

From the above figure it can be seen that majority of the global water treatment market is North America, with it having a share of 31.5% as in 2011.


Industries requiring water solutions

There are many industries that have massive requirement of water like textile, paper, oil and gas, fertilizer, brewery, cement. Desalination of sea water is a sustainable solution that many coastal states are adopting to satisfy their want of large amount of water. Although the treatment is expensive, but in the long run the cost is recovered. In textile mills, waste water is treated through reverse osmosis and is re-circulated as fresh water and used.

Similarly, the mining industry require huge quantities of water for cleaning out the soil from the metals. In textile and printing industry pigments that are used are harmful for soil. Agriculture can be harmed when these dyes reach the soil. The pH of effluent water has to be maintained so that the aquatic life is not harmed.

There is also a constant demand for clean water in institutions like hospitals, hotels, spas, resorts and laboratories, malls, school, IT Parks and construction sites. Urban and rural population are big consumers of water. Residential complexes, municipalities, water supply and sewage boards are always in need of efficient water solutions.

The industry is willing to accept new technologies but it is very price sensitive even when demand for such technology is increasing.


Available Water Technologies

Image

Water treatment giants have introduced various processes and technologies for each industry segment. The services offered by them include management of process water, pre-treatment, process water treatment, process application with resins and membranes and drinking water treatment. In addition to this, they provide various other services as well.

Drinking water treatment plants and common effluent treatment plant are in operation across India.

Raw water treatment is done by applying organic and inorganic chemistry that includes using in-process chemicals. Antiscalants, biocides, coagulants, defoamers, dispersants, drilling fluids, flocculants and many other products are involved in water treatment.


Strenghts os Water Treatment Market

Although U.S. water supplies rank as one of the safest in the world, some contaminants still can enter the drinking water after it has left the treatment facility. By getting a water treatment system installed, one can have more control over the quality of the water.

There are two modes of filtering for water treatment. They are –


  1. POINT OF ENTRY – here water softeners and whole house filter systems are used to treat water. The benefits of this method of treatment are as follows –
  • Removes all types of minerals that cause hard water
  • Reduces harsh effect on skin and fabrics
  • Uses less detergent and keeps clothes cleaner and whiter
  • Prolongs the life of various appliances and pipes
  • Removes the sediments coming in form water sources
  • Improves rinsing performance, making things easier to clean
  • Helps heaters (water heaters) work more efficiently


  1. POINT OF USE – here various other products are used like reverse osmosis and under sink water filtration for the treatment of water. The benefits of using this method are as follows –
  • Removes odors
  • Dispenses cleaner tasting water
  • Removes harmful chemicals or in other words contaminants such as lead
  • Saves money
  • Ecofriendly


Weakness of Water Treatment Market

Most of the water filters cannot remove organisms smaller than 3 microns in size. While protozoa such as Giardia (shown below) and Cryptosporidium are about 5 microns in size and can be filtered, water filters fail to remove out bacteria such as Cholera, E. Coli, and Salmonella and viruses such as Hepatitis A, rotovirus and Norwalk virus.

The safe solution is to always use a water purifier, however some of these filters have chemical additives have limitations that one needs to know about in order to prevent getting sick. All chemical additives have difficulty purifying water that contains sediment because the particles suspended in the water interfere with the chemical reaction.


DRIVERS OF THE WATER TREATMENT MARKET:

 Image

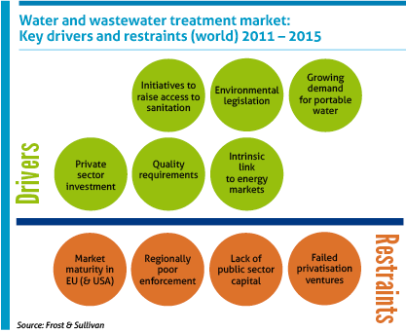
This figure clearly depicts the various elements that drive the water treatment market as well as the various restraints that the market faces.

World demand for water treatment products is projected to increase 5.7 percent per year to $59 billion in 2013, well above the rate of economic growth in essentially every region. In addition, the marketplace is evolving, with smaller players satisfying local needs.

Developing markets such as China and India will register the fastest growth in the next few years, due to continued industrial expansion and efforts to expand access to safe water supplies and adequate sanitation facilities, especially in rural areas.

In the developed markets, initiatives which focus on improving drinking water quality, reducing wastewater discharge and increasing wastewater treatment and reutilization rates will be in full force.

Despite the funding issues that beset the industry on both a global as well as local scale, water is still seen as an attractive asset class. The private sector will have a crucial role to play – by 2015, as it is estimated that 16% of the world’s population will be served by the private sector.

 Image


This table clearly tells us that the demand for the equipment used in the water treatment industry is increasing, which clearly shows us the growth of this sector in the years to come.


CONCLUSION:

Many new water treatment technologies are being rapidly adopted by industries that use water extensively, as they benefit through reuse of water.


 Image


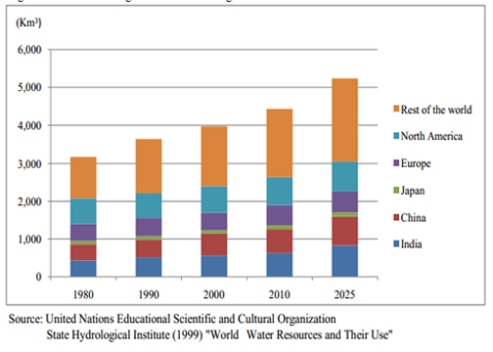
From the above figure it can be inferred that the rest of the world has the maximum usage of the water resources and hence water treatment is essential.

The Indian market is witnessing growth with emerging concepts like mobile water systems that can offer immediate relief in case of an accidental shut down in an industrial water system or provide treated water during maintenance.

The water market could be driven by investment in a major way by the government and the public sector companies. Phase I of Jawaharlal Nehru National Urban Renewal Mission (JnNURM ) is over and JnNURM-2 will have funding of about 1.75 lakhs crores for urban municipality water supply and sanitation projects. The growth will also be driven by the scarcity of water for industrial use which will drive industries to invest in water recycling in a HUGE way.


PUBLIC SAFETY WIRELESS MARKET

Mobile phones are no longer a luxury, but an important part of everyday life, especially necessary in times of crisis.  We all need robust communications, and we need them all the more during emergencies.

 Image

The above figure gives us a clear cut picture about the public safety network and the various solutions it offers.

There has always been a debate on how to focus on our nation’s police and firefighters with an advanced communications network that enables full inter-operability across multiple jurisdictions/departments/agencies and functionality even in the most difficult and trying of circumstances.

FirstNet is providing the leadership and collaboration with emergency responders across the country to bring the network to life – with the objective of protecting the homeland, saving more lives, preventing law breaking, solving crimes and keeping our communities safer. 

FirstNet will be funded from the proceeds of several spectrum auctions conducted by the Federal Communications Commission (FCC).  Spectrum provides the highways that enable wireless communications, and for first responders, the proceeds from upcoming spectrum auctions will endow the creation of a network dedicated to improved broadband communications.

This spectrum is extremely valuable because it can both travel long distances and allow wireless signals to penetrate building interiors to provide broadband connections where they can be hardest to reach.  This is why they call it beachfront spectrum, and it is absolutely critical that the spectrum is auctioned in a way that will ensure a competitive marketplace.

A healthy competitive wireless industry in itself is good for public safety. During emergency situations, we’ll all be able to communicate better, no matter whose network we’re making a call on or relying on for transmitting critical data. 

A wireless industry is intact that enables public safety departments across the country to have carrier choice and competitive pricing.


DRIVERS OF THE MARKET:

There are three key areas that drive growth in the broadbandenterprise and wireless markets:

  • Growth in video
  • Personal and interactive services
  • Multi-platform


Growth in video:

The continued growth of high definition and video on-demand has been on a steady incline. Video is 90 percent of the consumer Internet traffic today and 50 percent of video originates from mobile devices, which drives both broadband and wireless growth in tandem. Comcast and Netflix agreed to a ground-breaking pact to work together assuring viewers their Netflix video streams will be provided with the best possible speeds.

Personal and interactive services:

The second area of growth is in personalization and interactivity. Consumers want to watch what they want, when and where they want. Approximately 36 billion apps were downloaded in 2012 with 83 percent coming from Android and iOS devices. It’s estimated that one billion apps are being downloaded from iTunes every month.

Multi-platform:

The ability to offer multi-screen video for example watching Netflix on an iPad or NFL Live on Android phones, is also fueling mobile broadband growth today. This is driving broadband to homes and mobile devices, and fueling growth in content servers across the world to store content.


SWOT ANALYSIS:

Strengths

•          There is a lot of Cost advantage

•          There can be Asset leveraging done

•          There is Effective communication between the various network

•          High R&D team is involved

•          Innovation is the industries biggest strength

•          Online growth is maximum

•          Loyal customers will be attracted easily if performance is good.

•          Market share leadership will increase in a regular base

•          Strong management team is present in order to regulate the activities

•          Strong brand equity is available

•          Strong financial position

•          Pricing will fetch revenues


Weaknesses 

  • Bad communication
  • Diseconomies to scale
  • Over leveraged fiancial position
  • Low market share
  • Not innovative
  • Not diversified
  • Poor supply chain
  • Weak, damaged brand


Opportunities 

  • Acquisitions
  • Asset leverage
  • Innovation
  • Online
  • Product and services expansion

 Image

From the figure it is clearly visible that there is an opportunity for the growth of this market worldwide.


Threats 

  • Competition
  • Cheaper technology
  • Economic slowdown
  • External changes (government, politics, taxes, etc)
  • Exchange rate fluctuations
  • Lower cost competitors or imports
  • Maturing categories, products, or services


CONCLUSION:

 Image


This figure clearly displays that the global wireless market is changing and that by 2017, there will be a huge growth of this sector with the revenue reaching around 7,000 million dollars.

The future growth in the ongoing process of city-wide and municipal wireless broadband services is the main factor that leads to technology innovation in wireless broadband with an increase in the number of new services over the next seven years. This will be an added advantage for mobile wireless device, equipment and infrastructure developers. 


 Since there are places where natural disasters occur frequently. In these places public safety application and municipal wireless play an unmatched role in wireless broadband technology.


Wireless broadband technology is evolving at a fast pace due to its application in almost every field whether it is transportation, public safety, industrial usage, or in public services. The problems due to equipment sector experience and faulty network designs will result in long run depletion of technology which can be overcome with improvements in infrastructure and advanced network technologies. 


The spectrums in many countries of public safety are used in many applications due to limited spectrum availability in the network. With growing demand for public safety wireless communication, satellite communication is also taking a step forward which is necessary in times of disaster and emergencies where land communication does not work. 


Infrastructure development and the services market are expected to show huge growth in the next seven years which will help in future growth of wireless communication in public safety and municipal wireless communication. 


The public safety devices and equipment market is expected to grow in the next two years when infrastructure growth will give it a strong background in development of wireless technologies. This increase in wireless technology has future growth potential in the domains of public safety and municipal wireless communication.

Nanomaterials

Image


Nanomaterials are defined as materials with one external dimension in the size range from 1-100 nanometers. They have three external dimensions at the nanoscale. They are naturally occurring or are the incidental byproducts of combustion processes and are usually physically and chemically heterogeneous known as ultrafine products. Nanoparticles are intentionally produced and designed with very specific properties like shape, size, surface properties and chemistry. These properties are reflected in aerosols, colloids, powders etc. The behavior of nanomaterial depends on the surface area than the particle composition itself.  Relative-surface area is one of the principal factors that enhance its reactivity, strength and electrical properties. Nanoparticles can be bought from commercial vendors or by experimental procedures by researchers in the laboratory. A few examples of nanomaterial include carbon nanotubes, metal or metal oxide nanoparticles.


External forces shaping the Nanomaterials industry:

Customers

  • Global platforms
  • Technical service
  • Partnership
  • Application development
  • High perceived value
  • Awareness


Regulators

  • Environmental & human safety regulations
  • Govt. subsidy


Technology

  • R&D and Innovation to reduce cost
  • Cost effective technology
  • Process improvement
  • Quality control
  • Capital


Distributors

  • Technical Service
  • Specialization
  • Efficiency
  • Value-added
  • Marketing


Destabilizers

  • Global recession
  • Political instability


Workforce

  • Skills
  • Location


Competitors

  • Consolidation
  • Non-traditional/new entrants
  • Focus/specialization


Suppliers

  • Material specialization
  • Processed raw materials


 Image

 This figure shows us the various ways in which nanomaterials are categorized according to the location of the nanostructure that is found in the materials.


DRIVERS OF NANOMATERIALS MARKET:

  • Emerging Applications – It is expected that nanomaterials will be extensively used in emerging applications like water treatment, drug delivery, nanomedicines, etc.
  • Price – Decrease in price of nanomaterials will take place due to advanced production techniques
  • Patents – The number of patents regarding manufacturing of nanomaterials is increasing year after year. Nanomaterials have great potential in electrical and electronics applications because of their extraordinary electrical conductivity. Global recession induced cost/price sensitivity in E & E segment, given its potential to reduce manufacturing costs and increase product competitiveness
  • Emerging Trends in the Global Nanocomposites Industry

–       Trend A looks at the growing demand for high strength, durable structural materials

–       Trend B focuses on new material development and product design

–       Trend C aims at New and emerging market applications

–       Trend D focuses on the falling nanocomposites prices

–       Trend E focuses on huge expansion by existing suppliers and new entrants

–       Trend F Government support and R&D funding


GROWTH OF NANOTECHNOLOGY MARKET:

Image 

 From the above figure it is quite evident that the growth rate with respect to nanomaterials is to be increased to 33%, which clearly shows that there is a scope for this market in the future. It also shows us the increase in demand for nanomaterials from 2002 to 2012 by 4300 million dollars.


  • Growing nanotechnology market will boost the growth of nanocomposites.
  • In past 5 years, a huge amount has been invested in nanotechnology R&D by the USA and European countries
  • Japan shows a considerable inclination towards nanotechnology development, spending ~$1 B in nanotechnology R&D in 2010
  • Global expenditures for nanotechnology R&D expected to grow at ~23% until 2016


CONCLUSIONS:

The nano materials market is expected to grow about 23%  annual rate until 2016. Top 6 players have secured two-thirds of global nano materials market shipments; high opportunity for new players to enter this growth market. Decline in demand in 2009 for nano-enabled products in the automotive industry, such as automotive lubricants, catalytic converters, sensors and filters, among others, drove the heavy downturn in market opportunities for nano materials such as multi-wall carbon nanotubes(MWNTs) and ceramic nanoparticles.

 Image

This chart clearly tells us that the U.S market has a lot of growth potential and that nanomaterials market has a major opportunity of expanding significantly in the future.

Health care and energy markets were two main application areas which helped the global nanomaterial industry recover from the heavy downturn experienced in 2009. The healthcare industry is expected to surpass the electronic and electric industry in size over the coming 2-3 years, driven by nanotechnology advancements in biomedical field.

 Image

Various researchers have predicted that the demand for nanomaterials in the future will definitely increase, which is clearly depicted with the help of the above chart.

North America will remain the market leading region for several years as it has significant ongoing R & D activities in nano materials. It is expected that nano materials will broaden their markets as they enter into more applications such as drug delivery, armor, defense equipment, weapons, nano medicines and the like.


LOVE <3 <3

Image


You are on my mind all the time,

Why when you are not around I don’t feel fine?

Why do my eyes search for you?

Please tell me what did you do?

My heart beats fast when I feel your touch,

When I don’t get to see you I miss you sooo much.

I want you around day and night,

I don’t know if this is wrong or right?

You are making me fall for you every single day,

For time to freeze, I earnestly pray.

I wonder if you even know that I have feelings for you..

But trust me when I say that what I have for you is genuinely true.

Even though you are shy you are everything to me,

I sooo wish that we were meant to be…

I wish LOVE was the relationship between me and you,

Because having you will be like a DREAM COME TRUE!!

HADOOP

Apache Hadoop is a parallel distributed processing middleware technology which is applied across various industries to perform Big Data analytics. The data gathered by organizations are mostly unstructured. Hadoop-based applications are applied by organizations that require real-time analytics from data in any form such as audio, video, email or even machine-generated data from a multitude of sensors and data from external sources such as the Internet or it could also be data collected from social media.

Hadoop-based applications are applied across various business areas that have a strong web-based business process for various customer related analysis.

 Image

Scientific applications which require high degree of parallelism or need to operate on large volumes of data also benefit from MapReduce and Hadoop. Scientific applications are mostly used by companies in the Bioinformatics and Healthcare sectors. Hadoop apps such as HDFS, Hive, Pig, and Hbase have been developed by Apache Software Foundation to support storing, loading and transforming data in a Hadoop cluster. These Hadoop apps ensure that a smooth transition from traditional analytics towards Hadoop-based big data analytics takes place.


The Key Drivers of the Big Data Market:

  1. Opportunity to enable innovative new business models
  2. Potential for new insights that drive competitive advantage
  3. Data collected and stored continues to grow exponentially
  4. Data is increasingly everywhere and in many formats
  5. Traditional solutions are failing under new requirements
  6. Cost of data systems, as a percentage of IT spend, continues to grow
  7. Cost advantages of commodity hardware & open source software

Apache Hadoop, is providing an innovative and cost effective foundation for the emerging landscape of Big Data processing and analytics solutions.

Major differentiating factor that HADOOP has is that it provides a lot of flexibility. In addition to this it can also perform analysis and other data processing tasks over unstructured and semi structured data, just like how it handles structured data. Not only this, but it also allows SME’s to develop software that is proprietary in nature for big data solutions at a much lower cost when compared to other major big data vendors.


STRENGTHS:

  • Hadoop is a platform which provides Distributed storage & Computational capabilities both.
  • Hadoop is extremely scalable and is optimized for high throughput
  • HDFS uses large block sizes that ultimately helps IT works best when manipulating large files.
  • Scalability and Availability are the distinguished features to achieve data replication.
  • HDFS can replicate files for specified number of times that is tolerant of software and hardware failure.
  • Hadoop uses MapReduce framework which is a distributed computing framework and allows one to work over a large amount of data.
  • MapReduce let the developers to focus on addressing business needs only, rather than getting involved in the distributed system complications. 


WEAKNESS:

Following are the major common areas found as weaknesses of Hadoop framework or system:

  • Until the Hadoop 2.x release, HDFS and MapReduce will be using single-master models which can result in single points of failure
  • Security is also one of the major concern because Hadoop’s security model by default is disabled because of its complexity.
  • Hadoop does not offer storage or network level encryption which is a very big concern for government sector application data.
  • HDFS is inefficient for handling small files, and it lacks transparent compression.
  • MapReduce is a batch-based architecture and does not lend itself to use cases which needs real-time data access.
  • MapReduce is a shared-nothing architecture and hence tasks that require global synchronization or sharing of mutable data are not a good fit which can pose as a challenge.


OPPORTUNITY:

  • HADOOP market is still developing but growing at a tremendous pace, with a CAGR of 42.04%.
  • With the changing business situations and competitiveness across various industries,

      Organizations are showing high interest in employing big data solutions to stand out from the

  • Organizations could also completely replace their existing relational databases to make way for

      NoSQL databases.

  • Constant technological advancements and upgrades in the HADOOP market are further

      attracting more and more potential end users.


CONCLUSION:

The global Hadoop market revenue is expected to grow from $1.56 billion in 2012 to $13.95 billion by 2017, at an estimated CAGR of 54.9% from 2012 to 2017. In 2012 it was found that, North America held the largest share of the Hadoop market revenue at $0.84 billion; and is expected to reach $6.92 billion by 2017, at a CAGR of 52.4% from 2012 to 2017.


Global Hadoop & Big Data Analytics Market by Type, 2012- 2017 (%)

Image

Source: MarketsandMarkets Analysis

The figure tells us about the growth trend in the Hadoop market, for the period 2012-2017. The market has witnessed a considerable growth of 60.4% from the period 2013 to 2014; while from the period 2016 to 2017 it is expected to fall to 48.0%.

Organizations have constantly been looking for ways to effectively store, process and analyze large sets of data in a cost effective manner to gain valuable insights in order to maintain a competitive edge in the market.

Even though the adoption rate of Hadoop stands high at the present among organizations, it is expected to increase even more in the next 5 years owing to the maturity and advancement in technology.

GREEN CHEMICALS MARKET

                  Image     

Global warming and other environmental issues have been rising off lately. Few chemicals used in detergents and soaps have harmful side effects. Many industries are finding ways to improve their performance to become more eco-friendly. A leading distributor of cleaning and supplies, has recently introduced the Eco-Green series of green chemicals. The term ‘Green Chemicals’ implies that these chemicals are easily and quickly biodegradable and do not have harmful side effects. They are derived from plants and vegetables and make use of the chemical and colloidal properties of certain plant extracts. The green chemicals easily outscore the detergent and soaps that make use of artificial chemicals. The green cleaning products consists of small nano-sized particles that can filter into any surface and disrupt the bonding between stains and the surface.

Construction chemicals are the chemicals that are added in specific formulations with the cement or concrete during construction to meet the functional, aesthetic, or design requirements of any infrastructure. Green chemicals are the chemicals that do not contain the components that are harmful to human health or environment. Green chemicals are increasingly preferred in construction industry now-a-days due to their numerous benefits such as strength, increased durability, color, chemical resistance, minimum use of water and cement, ability to withstand climatic changes, and protection from natural factors such as fire and heat among others. These are widely used in the construction of residential, industrial, commercial, and other infrastructure projects.

Green chemicals can be categorized into three major types as

• Concrete admixtures

• Adhesives and sealants

• Flame retardants


DRIVERS OF GREEN CHEMICALS MARKET:

• New technologies

• Regulatory factors

• Consumer preference

• Economic factors

The primary factor is to minimize waste in the chemical production process, replacement of existing products with less toxic alternatives and to shift to renewable and non-petroleum stock.

Rapid advances in biotechnology has created a new tool kit for the manipulation of organisms to produce industrially useful component with great efficiency and minimum waste. Rising price of petroleum has fuelled interest and investment in finding alternative renewable feed stocks.

International Council of Chemical Association is a global chemical industry to initiate on improving health, environmental performance, security enhancement and communication to stakeholders about products and processes. The Green Chemical sector is still in its early growth stage with tremendous future potential.

STRENGTHS:

1. Savings

• Reduction in regulatory & compliance cost of ETP

• Saving in water consumption


2. Process

• Increased plant efficiency

• Reduced utility cost


3. Output

• Product differentiation for finished product


4. Social

• Community well being

• To showcase “Green efforts”


5. Human health:

• Cleaner air: Less release of hazardous chemicals to air leading to less damage to lungs

• Cleaner water: less release of hazardous chemical wastes to water leading to cleaner drinking and recreational water

• Increased safety for workers in the chemical industry; less use of toxic materials; less personal protective equipment required; less potential for accidents

• Safer consumer products of all types: new, safer products will become available for purchase; some products will be made with less waste; some products will be replacements for less safe products

• Safer food: elimination of persistent toxic chemicals that can enter the food chain; safer pesticides that are toxic only to specific pests and degrade rapidly after use

• Less exposure to such toxic chemicals as endocrine disruptors


6. Environment:

• Many chemicals end up in the environment by intentional release during the unintended releases or by disposal. Green chemicals either degrade to innocuous products or are recovered for further use

•Plants and animals suffer less harm from toxic chemicals in the environment

• Lower potential for global warming, ozone depletion, and smog formation

• Less chemical disruption of ecosystems

• Less use of landfills, especially hazardous waste landfills


7. Economy and business:

• Higher yields for chemical reactions, consuming smaller amounts of feedstock to obtain the same amount of product

• Fewer synthetic steps, often allowing faster manufacturing of products, increasing plant capacity, and saving energy and water

• Reduced waste, eliminating costly remediation, hazardous waste disposal, and end-of-the-pipe treatments

• Allow replacement of a purchased feedstock by a waste product

• Better performance so that less product is needed to achieve the same function

• Reduced use of petroleum products, slowing their depletion and avoiding their hazards and price fluctuations

• Reduced manufacturing plant size or footprint through increased throughput

Improved competitiveness of chemical manufacturers and their customers


WEAKNESS:

• The idea that the chemical industry will one day rely only on renewable feed stocks to replace fossil fuel-based ones.

• Using only renewables would simply take up too much land to produce the necessary material. There is potential for Brazilian sugar cane and fibers.

• The chemicals industry is highly efficient at using oil and gas feed stocks.

• Last month BASF formed a joint venture with Denmark-based biotechnology firm Novozymes and US agribusiness giant Cargill to produce bio-based acrylic acid.


CONCLUSION:

There is a potential to bring society and science closer. Innovations backed by sound policies and regulations will speed up large-scale adoption, even though initially costs may go up. Gradually costs will come down over time. But greening chemistry alone will not be enough. Industry needs to share in real time the pros and cons of the greener choices and not just promote the positives. People inside the fence need to include and engage folks outside the fence by explaining complex and evolving scientific information in a language that is understandable to the average citizen. Those outside the fence need to understand the difficulties of the folks inside the fence, and ultimately, learn to trust them. Open communications and dialogue should be encouraged. .

Image


Pike Research, meanwhile, reported that the use of green chemistry is expected to save the chemical industry $65.5bn by 2020. Pike Research included in their definition of green chemistry pathways and industrial activities such as waste minimization in the chemical production process, replacement of existing products with less toxic alternatives, and the shift to renewable, non-petroleum based feed stocks.

Green chemistry markets, just represents a market opportunity of $2.8bn in 2011 reaching to $98.5bn by 2020. By 2020, it is expected that the total chemical industry will expand to $5.3 trillion in annual revenues.

In July, BCC Research reported the global market for green technologies is expected to be worth $312bn in 2015 from $200bn in 2010, showing a growth rate of 9.2%/year.

Rise in the infrastructure developments across the globe due to urbanization is in full swing. Large scale investments in public and private sectors are driving the demand for the chemical and materials required in construction. Governments are undertaking large scale projects such as construction of road lines, highways, and public infrastructure projects. Contractors and builders are considerably cutting down on under construction time by making use of new chemical technologies and construction aids.

This is leading to the reduction in construction expenditure and improvement in the quality of work. Although, green chemical technologies are currently used in large scale infrastructure developments such as highways and bridges, they are increasingly accepted for use in residential applications. It is expected that concrete admixtures will be used in the construction of smaller infrastructures too in near future.

MOBILE SECURITY SOLUTIONS

20140306_175147

A mobile today, is a device that is a major extension of everyone’s life. It is a device that is used not only to make calls or message but to also store our most private conversations and confidential information, keep a record of your contacts in your phone book, photo album, social life an our wallet. All these features are found incorporated in the same device. It is like one’s right hand, to be kept safe, so that the information is secure.

Mobile security solutions focuses on securing our privacy by helping us manage our devices, irrespective of what we are doing or where we are. The antivirus in our mobile phones protects the device from harmful websites and links as well as from the latest viruses. This leaves you worry free and keeps your personal data safe.

One of the renowned mobile security solutions is McAfee, that protects the mobile as well as all the personal data in it, in case of any loss or theft and also enables us to have a backup and restore the data.

In addition to this, it also safeguards the mobile from viruses and spyware, with protection provided for Android, Symbian devices and Blackberry as well. It enables us to surf the web safely while blocking all risky mobile websites.

McAfee also has a Virus Scan that scans and cleans the malware from mobile devices which could be in the files, memory cards, downloads, attachments, etc.  The option ALWAYS-ON, identifies viruses and removes them before it harms the contents of the phone.

DRIVERS OF GROWTH:

In the world today, mobile devices are used in multiple ways, as they are used for both online and offline purposes. Hence this market is expected to experience a huge growth in the coming years, with an increase in the number of mobile phone users. Another reason for the growth of the mobile security market would be the increased awareness anout mobile security among the public.

Some of the major drivers of the mobile security market are e-mail spam blocking, malware removal and antivirus. It can also be noted that, the latest technological development in the mobile security sector and good amount of research in this sector has definitely contributed to the growth of this market.

The major driver for this market is the concern for protecting the corporate information and being vulnerable to various threats already existing in the market. Increase is mobile malware is also a driver that is driving the dynamic market of mobile security.

The mobile security market can be segmented as follows –

  •          Identifying the management
  •          Data security
  •          Service of security
  •          Device Security
  •          Private virtual networks
  •          Device management

But in short the mobile security market could also be segmented as,

  •          E-mail spam blocking
  •          Anti-virus
  •          Malware removal

The other key players dominating the mobile security industry are – NetQin Mobile Inc, Symantec, F-Secure, Mobile Active Defense, etc.

The growth of the mobile security market is expected to be at a CAGR of 47.21% over the period 2012-2016.

Another major driver for the growth of the mobile security market is the growing popularity of tablets as well as smartphones. With the increase in demand for smartphones and tablets over the years, due to the growing network, and the need for the device, both for professional as well as for personal use, the demand for mobile security services has increased too.


CONCLUSION:

With the advancement in technology, sophisticated devices, having the capabilities of computers are being invented. A major drawback found in this, is that, the no. of hackers are increasing as well, as they are developing viruses and malware to extract data from the various devices. This is definitely leading to an outdated security solution, which is making the customer or in other words the end-user a little hesitant in installing such security solutions.